A revamped cost curve for reaching net-zero emissions
How to find the most cost-effective ways to cut carbon
The science is clear: the U.S. needs to drive down carbon emissions to net-zero by 2050 in order to avert the most catastrophic impacts. What’s less clear is how policymakers should chart the path there with so many carbon-cutting policies and technologies to choose from.
Using the latest energy models, EDF teamed up with Evolved Energy Research to create a new and improved cost curve that provides a roadmap for policymakers exploring ways to get to net-zero carbon emissions. The curve demonstrates the need for policymakers to support big, low-cost cuts in carbon emissions now, as well as the need to support the development of newer technologies that can help get us past the finish line.
What is a Marginal Abatement Cost curve?
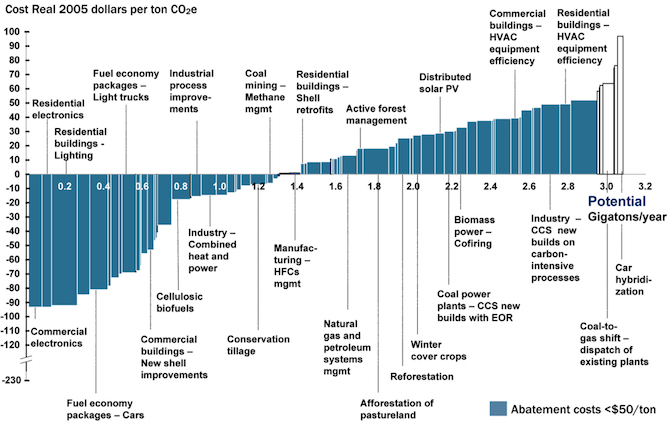
When considering ways to cut emissions, policymakers have often used a tool called a marginal abatement cost (MAC) curve to compare the cost and emissions impact of different technologies. However, traditional MAC curves, like the one popularized by McKinsey & Company in 2007 below, have noted limitations.
Since they only look at a single measure at a single time, they do not show how technologies interact in the energy system or how to scale and sequence investments over time — questions that matter enormously for driving down emissions at the pace and scale we need to beat the climate crisis.
Traditional MAC curve
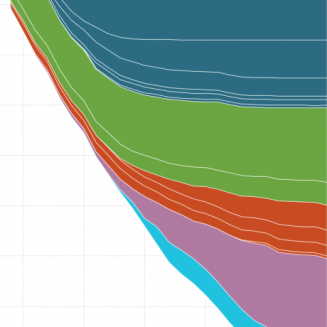
Our new MAC 2.0 curve
Our MAC 2.0 curve shows the annual carbon pollution reductions from different measures across the energy system that become accessible at different marginal abatement costs — or the incremental costs of reducing carbon pollution. It also offers insights on the optimal timing and sequencing of actions over the next three decades.
Moving from top to bottom, the curve shows how emissions decline as more measures become cost-effective and therefore more accessible at higher marginal abatement costs. In other words, the highest point on the y axis represents emissions from the baseline scenario and the lowest point shows how all measures deployed in coordination could lower carbon emissions from industry and energy use to net-negative levels.
Each segment represents an individual measure, such as onshore wind, and colors correspond to related groupings of measures (e.g. electricity).
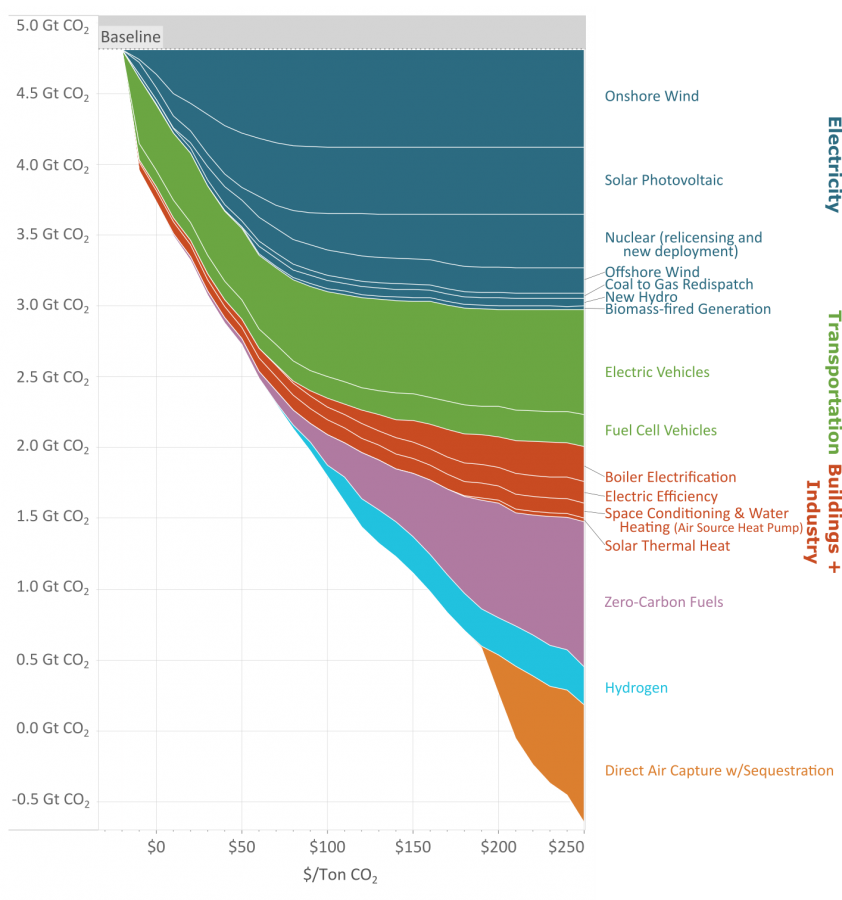
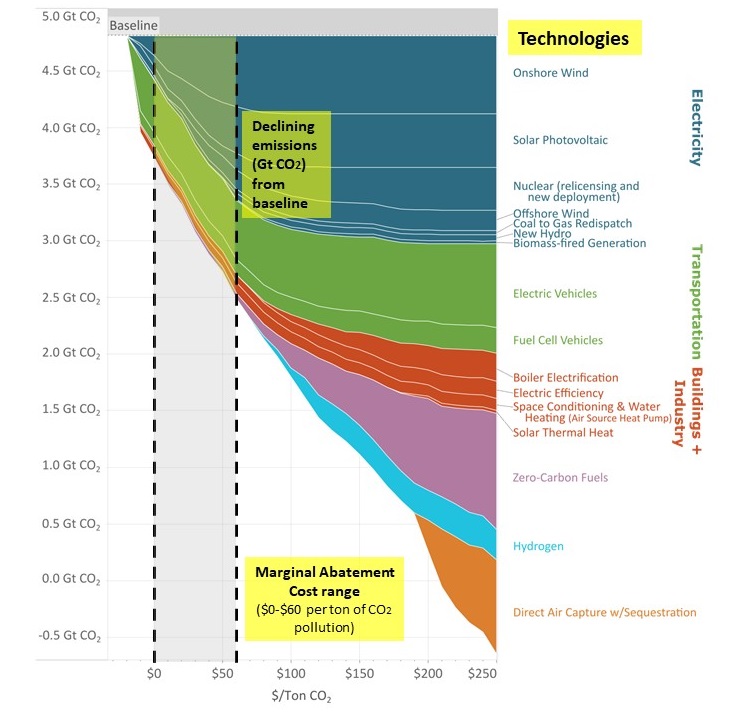
You can examine the technology deployment and reductions in annual emissions at a single marginal abatement cost, such as $0 per ton, or in a range of costs, such as $0 to $60 per ton.
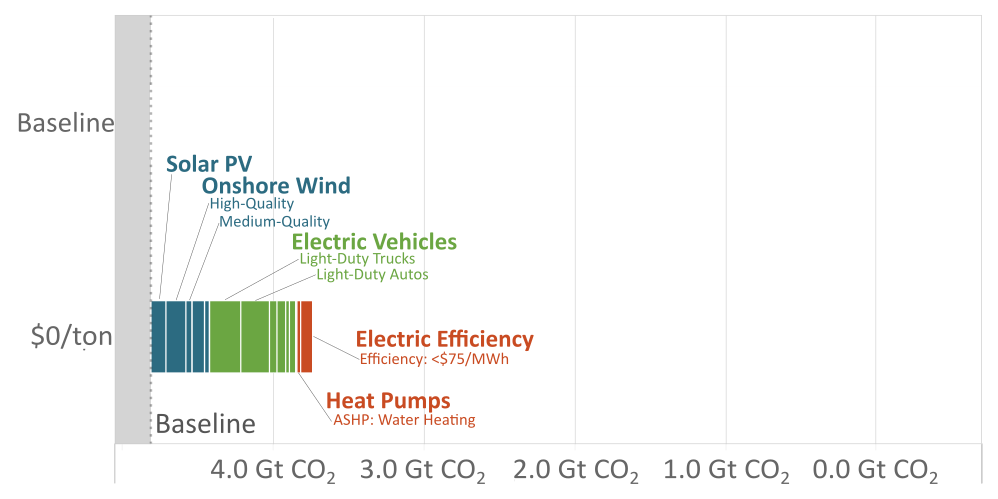
In the marginal cost range of $0 to $60 per ton of CO2 pollution (on the x axis), the deployment of clean technologies in electricity and transportation, as well as in some buildings and industry can reduce annual carbon emissions by roughly up to 1 gigaton. This is found by subtracting the annual emissions at $60 (2.5 gigatons) from the annual emissions at $0 (3.75 gigatons).
At this particular cost range, the electricity and transportation sectors contribute the bulk of the reductions (as shown by the width of these measures in blue and green, combined). Measures like zero-carbon fuels, on the other hand, contribute very little reductions because they are not yet cost effective.
What the new curve tells us about the path to net zero CO2
Zooming in on the different cost ranges offers more insights on 1) technology deployment levels, including at which marginal abatement cost particular technologies become accessible, 2) emissions impact of specific technologies and 3) policy implications. Click the cost ranges below to explore.
- Technologies: Many measures in the power and transportation sectors are cost-effective right now, including several electric vehicle classes, electric efficiency, high-quality solar PV and onshore wind resources, and nuclear relicensing. The use of heat pumps in buildings is also available.
- Emissions: Together, the measures in this range represent more than 1 gigaton of potential annual emission reductions by 2050 or 22% of way toward net-zero carbon emissions by 2050.
- Takeaways for policy: Achieving these emissions cuts will require policies that address non-cost barriers limiting adoption right now, such as lack of consumer awareness or incentive structures. These can be addressed with targeted policy or programs, such as energy efficiency programs.
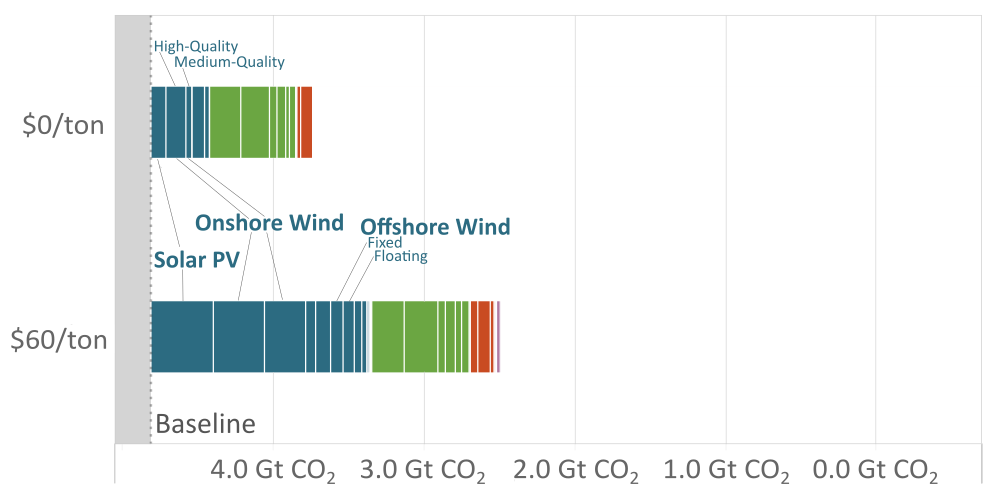
- Technologies: At modest costs, clean electricity measures including solar PV, onshore wind, and offshore wind offer the biggest opportunity for cuts in emissions.
- Emissions: These measures could achieve an additional gigaton of additional annual reductions or roughly halfway (48%) to net-zero carbon emissions when combined with measures in the previous cost range.
- Takeaways for policy: Policies that clean up the grid, such as clean energy tax credits, could drive these reductions.
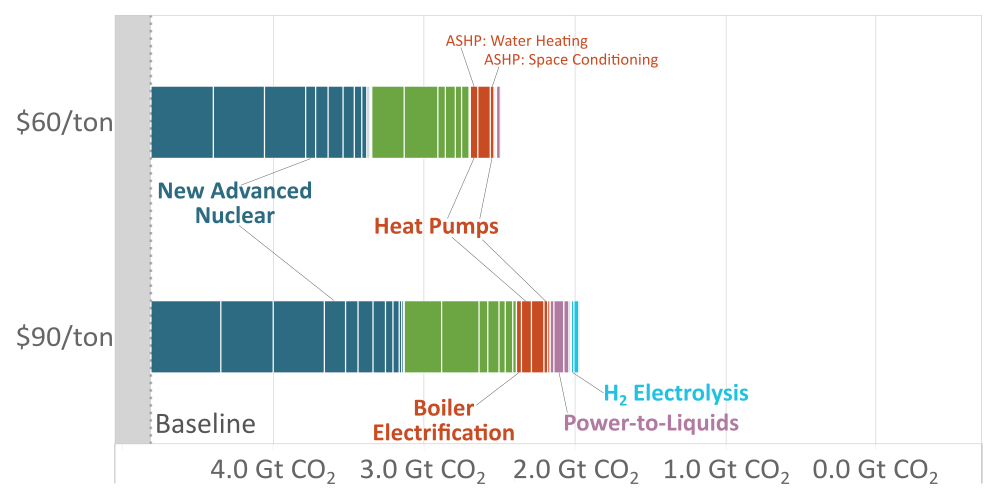
- Technologies: Incremental deployment of renewables continues in this range but at a much slower rate, involving resources with higher integration costs (e.g., new transmission lines, energy storage) and lower energy generation for the same installed capacity. Several measures to support the integration of variable renewable generation start to become cost-effective in this range, including electric boilers (a cleaner alternative to industrial heat), hydrogen electrolysis (carbon-free hydrogen production from renewable and nuclear resources), and power-to-liquids. New advanced nuclear power deployment also becomes cost-effective and presents significant potential to reduce emissions by providing zero-carbon electricity for regions with constrained renewable resources. Additional heat pump deployment in regions with less conducive climates to heat pump performance and electric efficiency also become available.
- Emissions: These measures could achieve half a gigaton of additional annual reductions or 59% of the way toward net-zero carbon emissions when combined with measures in previous cost ranges.
- Takeaways for policy: Policies must anticipate the need for high levels of electric vehicles and renewable energy deployment. Streamlined transmission siting rules and efficient electricity rate design are a few examples of policies that will be essential for achieving the full potential of these measures.
- Technologies: Zero-carbon fuel measures, particularly those derived from biomass, become a significant driver of emission reductions in this range. These include biomass-derived fuel measures that capture their carbon emissions, power-to-liquids measures that lead to the deployment of synthetic fuel technologies, and low-carbon hydrogen production that also drives reductions in emissions. Electric boilers come online as an industrial heat alternative and enable substantial emission reductions, both by displacing natural gas boiler emissions and by interacting with the electricity sector to support more renewable integration.
- Emissions: These measures could achieve nearly 1 gigaton of additional annual reductions or 77% of the way toward net-zero carbon emissions when combined with measures in previous cost ranges.
- Takeaways for policy: Zero-carbon fuels will require technologies that are not yet commercial or not currently deployed at a significant scale. Therefore, support for these technologies today, through research and development, early-stage commercialization, and ultimately large-scale deployment, is necessary to achieve net-zero emissions.
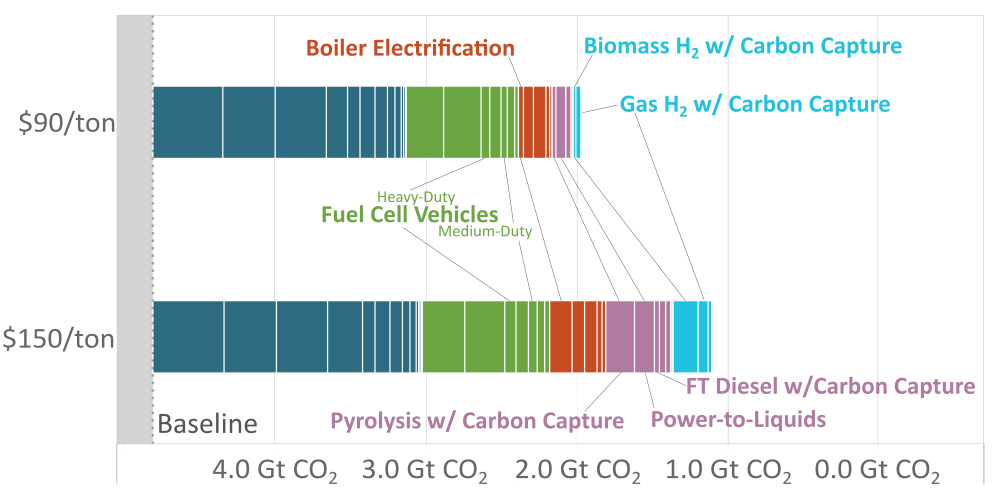
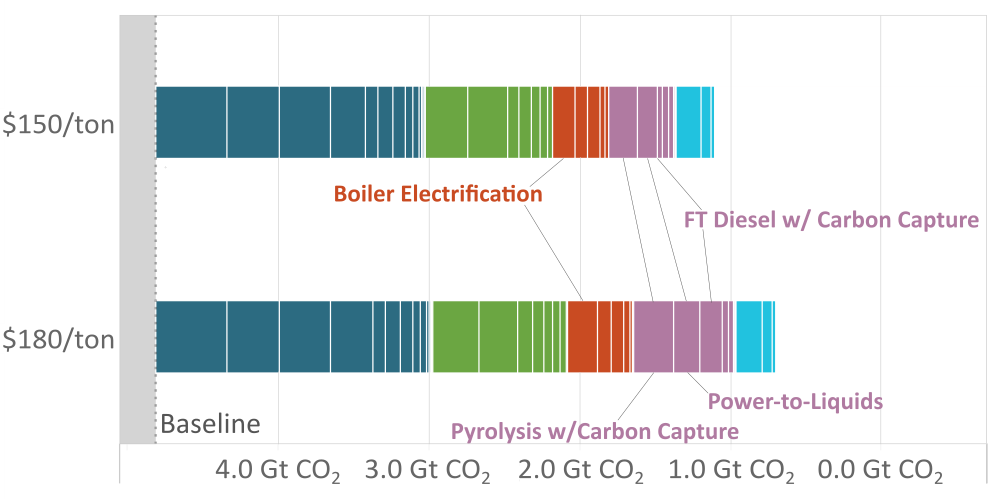
- Technologies: In this range, zero-carbon fuel measures become the major driver in emissions reductions. Deployment of biomass pyrolysis and fischer-tropsch diesel continues, but with higher marginal abatement costs due to supply constraints. Power-to-liquids and electric boilers, both of which depend on linkages to other sectors that face the same higher marginal abatement costs, are large contributors to emissions reductions in this range as well.
- Emissions: These measures could achieve nearly a half gigaton of additional annual reductions or 85% of the way toward net-zero carbon emissions when combined with measures in previous cost ranges.
- Takeaways for policy: Zero-carbon fuels will require technologies that are not yet commercial or not currently deployed at a significant scale. Therefore, support for these technologies today, through research and development, early-stage commercialization, and ultimately large-scale deployment, is necessary to achieve net-zero emissions.
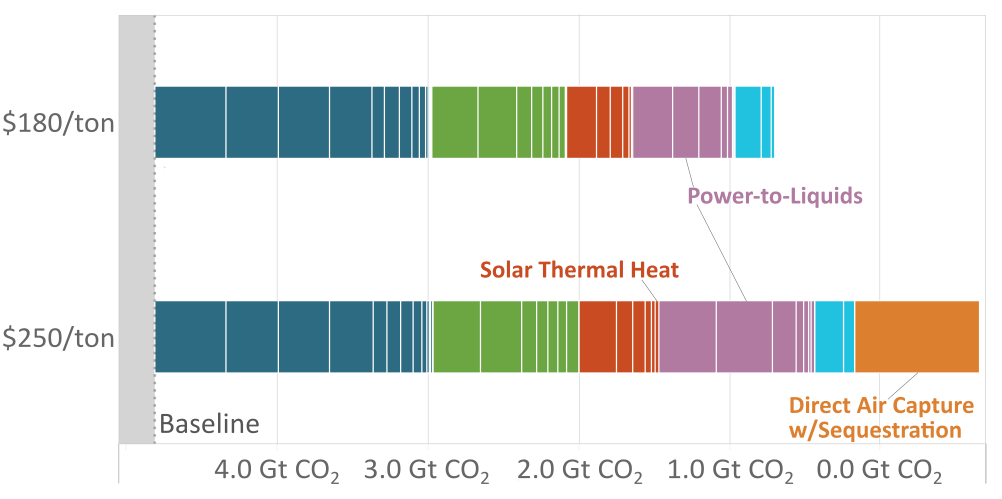
- Technologies: Deployment of direct air capture (DAC) with sequestration plays a central role at costs exceeding $180/ton. This is driven by the availability and cost of zero-carbon electricity, which depends on deployment of measures in previous ranges — cleaning up electricity and supporting renewable resource integration. Direct air capture for utilization (power-to-liquids) is deployed at lower costs as well as in this range, but for additional emission reductions through sequestration, marginal costs need to approach $200/ton to deploy these measures. Additionally, industrial solar thermal heat also becomes an option to displace natural gas usage in certain regions with high solar insolation.
- Emissions: These measures could achieve more than a 1 gigaton of annual reductions or getting beyond net-zero carbon emissions when combined with all measures in previous cost ranges.
- Takeaways for policy: The possibility of DAC playing this role should be anticipated, and policy should support near-term commercialization so the technology is available to be deployed at scale when it becomes economical.
Explore further with an interactive version of the MAC 2.0 curve
In this interactive version, you can select an individual measure to see its potential to reduce emissions in million metric tons (MMT of savings) at different marginal abatement costs (MAC) on the x-axis. The ranges I-VI denoted on the x-axis categorize the MAC ranges described above.
You can also select multiple measures to see their collective potential to reduce emissions.
MEDIA CONTACT
Chandler Green
(803) 981-2211 (office)