FAQs

More about our analysis of New Mexico methane emissions

What are the main findings of the analysis?

Updated EDF analysis shows that New Mexico’s upstream oil and gas problem with methane waste and pollution has persisted and grown. Total methane emissions are now over 1.1 million metric tons per year, representing roughly 5 times more emissions than EPA data suggest.

These emissions are estimated to cause the same near-term climate damage as 25 coal-fired power plants or 21 million automobiles, and result in $271 million worth of lost gas a year.

How did EDF conduct this analysis?

EDF’s analysis used two slightly different approaches, one for the Permian Basin in Southeast New Mexico and another for the San Juan and Raton basins.

In the Permian Basin, EDF's estimate is based on peer-reviewed satellite measurements from the Tropospheric Monitoring Instrument (TROPOMI) collected between May 2018 and March 2019. The natural gas leakage rate observed in these measurements was assumed to be constant for all of 2019 across the Permian, and 2019 production data was then used to calculate a basin-wide emissions estimate.

In the San Juan and Raton basins, EDF applied the methods of a 2018 Science study to estimate emissions from production sites. This approach integrates site-level measurement data from over 400 well pads across six U.S. basins validated by aerial measurements taken in New Mexico. The resulting basin-level estimates align closely with aircraft-based estimates from the San Juan reported in Smith et al 2017. Emissions estimates for 2019 were calculated by multiplying the 2017 basin-level emissions by the ratio of 2019 to 2017 gas production.

For the gathering and boosting segment, EDF estimated emissions using the approach from the 2018 Science study. Compressor station emissions were based on New Mexico-specific loss rates based on Marchese et al 2015. We included emission estimates from gathering pipeline leaks based on EPA emission factors, but these values are highly uncertain.

The complete methodology for this analysis is available for review.

Why did EDF apply two different methods in the state?

In the San Juan, EDF found that basin-level emission estimates based on the 2018 Science study’s findings agreed with recent peer-reviewed, aircraft-based measurements (Smith et al 2017). This validates that measurement data from the other six U.S. basins is representative of the San Juan.

In the Permian Basin, which is currently the focus of many measurement studies, EDF drew on findings from a recent peer-reviewed study (Zhang et al. 2020) based on satellite observations. Other measurement studies currently targeting the basin, including EDF’s ground-based Permian Methane Analysis Project, strongly align with Zhang et al’s findings and underscore the efficacy of satellite-based measurement at this scale.

Why is EDF's methane estimate higher than the EPA emission estimate?

EDF's estimates are based on a combination of some of the most up-to-date, peer-reviewed methods and satellite remote sensing data that aligns closely with direct site-level measurements. The EPA estimate is based on emissions reports that only the larger oil and gas operators – those producing more than 25,000 metric tons CO2e -- must self-report to the EPA’s Greenhouse Gas Reporting Program (GHGRP). This means that a significant number of operators who fall below the production threshold do not report emissions.

Emissions from production and gathering facilities are reported at the basin-level for specific sources using prescribed methods. The EPA estimate we provide is an approximation of New Mexico emissions that allocates reported basin-level emissions by energy production.

The primary reason emission estimates differ is that reporting operators are required to calculate their emissions using modelling formulas, not actual measurement data. These formulas and their assumptions, which multiply activity data (e.g. number of pneumatic controllers) by emissions factors (e.g. average emissions per pneumatic controller), have been repeatedly shown to dramatically underestimate total emissions by failing to account for malfunctioning equipment and other abnormal conditions that cause high, variable emissions.

What do we know about emissions from malfunctioning equipment?

A number of scientific studies – including a study of Barnett Shale well pads – have found that emissions from abnormal conditions such as malfunctioning equipment are responsible for a significant portion of industry’s total methane emissions, but are often excluded from official emission inventories.

One of the largest methane studies to date, which surveyed over 8,000 well pads nationwide, found these emissions are random, unpredictable and ubiquitous. Researchers suggest cost-effective ways to reduce pollution, including regularly checking oil and gas sites for malfunctioning equipment and focusing on better site design.

We do not think that all emissions are from malfunctioning equipment. Intentional sources like pneumatic controllers and liquids unloading emit large quantities of methane, and it is possible that some of the emissions attributed to “abnormal conditions” are from these sources, but are underestimated due to issues such as underreporting. However, almost all of these emissions are avoidable with leak detection and repair programs or changes to site engineering to improve operational efficiency.

How did EDF calculate VOC emissions?

Emissions of volatile organic compounds were estimated from methane emissions using basin source-specific methane to VOC ratios from a published Western Regional Air Partnership report [PDF].

How did EDF calculate the total volume of flared gas?

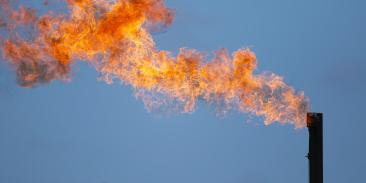
Flare locations and their estimated volumes of flared gas were obtained from the NOAA VIIRS dataset.

How did EDF calculate the total value of wasted gas and lost tax/royalty revenue?

After summing estimated methane emissions and estimated flared gas, the total amount of wasted gas and the 2019 market rate for natural gas were used to calculate the total value of wasted gas.

Lost tax and royalty revenue was then calculated using this figure and a number of assumptions fully outlined in the methodology.

How did EDF calculate potential emission reductions from New Mexico’s proposed rules?

EDF analyzed the potential impacts of the rules proposed by NMED and EMNRD by estimating percent reductions for each of the emission source categories they address, and then factoring the exemptions contained within the proposed NMED rule into the model for determining total possible emission reductions.

The number of facilities and estimated emissions unaddressed by the NMED rule, which exempts stripper wells and those with estimated emissions below a specific threshold, were calculated by identifying wellsites in the NMED database that fall below its proposed emission threshold and using production data from Enverus/DrillingInfo to identify applicable stripper wells.

For further detail on this analysis and how EDF mapped wellsites exempt from the state’s proposed rules, please see the full methodology.

How can New Mexico achieve comprehensive emissions reductions?

The emissions rules proposed by Gov. Lujan Grisham’s administration are an important starting place for tackling the state’s pollution problem, but exemptions contained within the Environment Department’s proposed rule would exempt roughly 95% of wellsites across the state.

Closing this emissions loophole is critical for delivering a comprehensive set of nationally leading controls that will dramatically reduce this emissions problem and protect New Mexico’s air quality and public health.

Together, the state’s proposed rules only reduce 21% of methane emissions and 19% of VOCs, while comprehensive rules could reduce 56% of methane emissions and 58% of VOCs.