


The Air Insights analysis suite
Purpose-driven analysis to translate local air quality data into action
Date updated:

What is Air Insights?
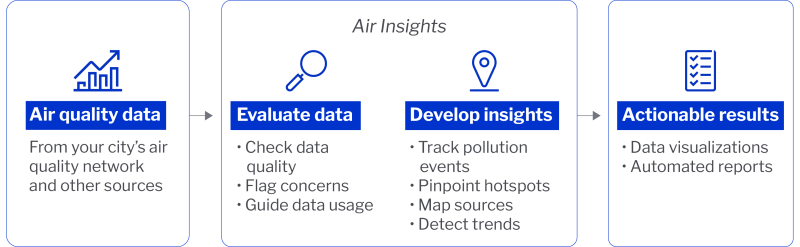
Cities around the world are collecting more air quality data than ever, but technical and capacity gaps can keep them from turning that data into actions that deliver cleaner air and better health. To close these gaps, EDF is developing Air Insights, a suite of open-source tools that turns pollution measurements into localized insights that cities can act on.
For over a decade, EDF scientists have partnered with cities to pioneer models, analytical tools and other methods to track pollution hotspots and pinpoint local sources. Air Insights brings these capabilities and more together into one package that guides city teams, community leaders and scientists in implementing clean air policies and interventions that work.
Co-create Air Insights with us
Become an Air Insights city: Contact us via this form
Get the Air Insights code package
Want to learn more? Have a good use case to share? Reach out to our team at edfair@edf.org.
How Air Insights works
What can Air Insights do for your city?
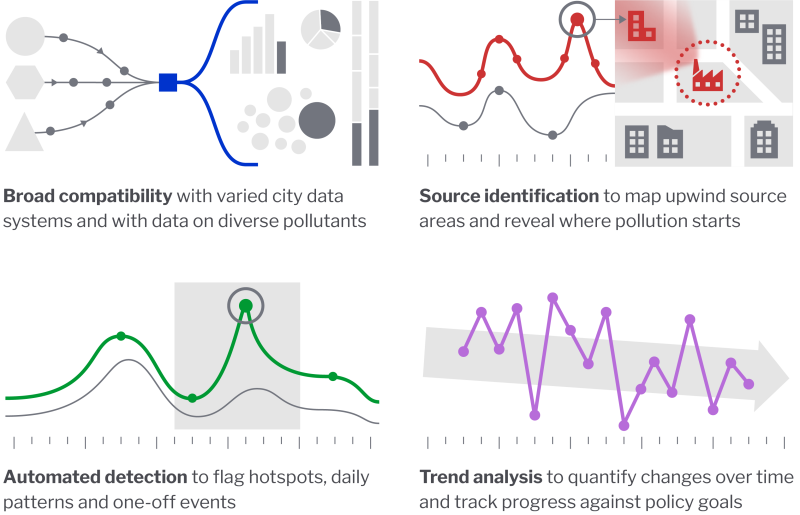
Air Insights offers cities a menu of analytical and data visualization tools that can integrate with their existing air quality management systems via an open-source code package. Written in Python and hosted on GitHub, this code package includes user-friendly example notebooks for each tool. Adaptable to each city’s unique circumstances and needs, Air Insights offers four core capabilities:
Questions Air Insights can help answer
Designed for and shaped by city air quality teams, policy makers, advocates, and researchers, Air Insights delivers localized answer to critical questions about air pollution, such as:
- Where are pollution hotspots and when do they happen?
- What pollution sources are likely contributing to hotspots?
- Are existing policies or interventions improving air quality?
- How is local air pollution changing over time?
- Is my city’s data reliable enough to take action on?
Resources
- Interactive tool
Get the Air Insights code package
- Fact sheet
Air Insights: Turning local air quality data into action
- Interactive tool
Air Tracker: Mapping local air pollution
- Blog post
EDF’s Air Tracker expands to Rio de Janeiro, aiding efforts to cut air pollution
- Press release
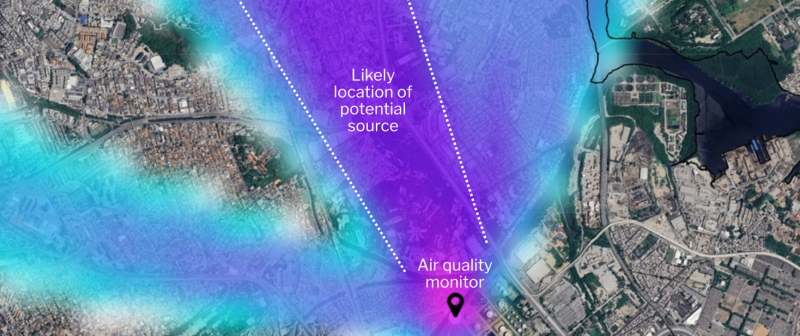
Interactive air pollution visualization tool to help São Paulo pinpoint hotspots and enforce air quality standards
Your gift can help reduce dangerous pollution
Give now to defend our planet:
Donate now and triple your impact to build a cleaner, safer, more affordable future in 2027 and beyond.
Give now to defend our planet:
Right now all gifts will be matched 300% during this special Giving Tuesday offer.
Give now to defend our planet: