


Collaboration with PSE&G
Data helps prioritize gas line replacement
Using methane leak data developed by EDF to prioritize pipeline replacement efforts, Public Service Electric & Gas (PSE&G), New Jersey's largest utility achieved an 83% reduction of methane emissions by replacing one-third fewer miles of gas lines than that needed to achieve the same result under a business as usual scenario.
The effort was part of a three year, $905 million program approved by the New Jersey Board of Public Utilities in November 2015.
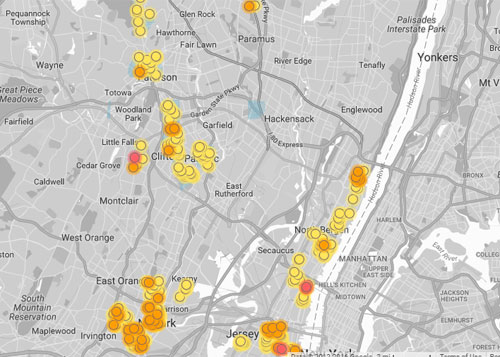
Map: Impact of leak flow rate on gas line replacement priority
EDF quantified the overall methane leak flow rate associated with gas lines in 30 one-square-mile grids that PSE&G had identified for replacement and ranked the grids by that flow rate. The map reflects that PSE&G replaced a relatively small proportion of pipeline miles to achieve big benefits.
Select an area to see the ranking before and after incorporating leak flow rates.
Some grids had an "original ranking" that was greater than 30, because PSE&G has targeted a total of 52 grids for replacement. EDF quantified leak flow rates in the 30 grids that are shown in the map.
About this collaboration
Over the three year period from 2016 through 2018, PSE&G is planning to replace 270 miles of low-pressure cast iron distribution pipes ("gas lines") on their system, out of a total 510 miles of pipeline targeted for replacement over this period. How quickly PSE&G reduces the leak flow rate associated with these gas lines depends on the order in which they are prioritized for replacement.
This effort draws on a pioneering collaboration among PSE&G, EDF, and its partners, Google Earth Outreach and Colorado State University. Using cutting-edge spatial analytics methods developed by scientists at Colorado State University and methane sensors specially fitted to a Google Street View car, data indicating the location and relative size of methane leaks from underground lines was gathered in select areas of PSE&G's service territory. PSE&G provided EDF with locations and types of gas lines in areas it was targeting for replacement, making it possible to gather data relevant to the company's gas line replacement efforts.
For six months in 2015, the Street View car took millions of individual readings over hundreds of miles of roadway in PSE&G's service territory in New Jersey. Our research team used algorithms developed and tested over several years to assess the vast data stream.
Map: New Jersey methane leaks
Click for interactive map
The leaks presented on this map represent only a snapshot in time. A number of the leaks identified through this collaborative project have already been repaired or eliminated through the replacement of cast iron pipes, including all leaks deemed hazardous by PSE&G's existing leak grading system.
By using that data to help plan their gas line replacement efforts, PSE&G was able to reduce methane emissions more quickly, by replacing significantly fewer miles of gas lines than would have been necessary to achieve the same emissions savings without the new data.
Methodology
PSE&G divided its service territory into one square mile grids that were proposed for gas line replacements, and ranked each grid (displayed as "original ranking" in the map above) using an algorithm that considers safety risks associated with gas line segments. EDF quantified the overall leak flow rate associated with gas lines in a subset of 30 grids, and ranked the grids on this basis. Leak flow rate per mile reflects the volume of methane released per minute for a mile of gas line.
Using their original ranking algorithm, PSE&G replaced grids with the highest rankings first, and used EDF's leak flow rate ranking to determine relative priority among grids with comparable rankings. In other words, where grids had similar original rankings, the grid with the higher leak flow rate ranking was prioritized first, locking in reductions in methane emissions more rapidly than otherwise possible, while keeping safety considerations paramount.
Results
Our readings indicated an average of about one leak for every mile of gas line within grid areas where leak flow rate was quantified.
Cars with methane sensors took readings from May-November 2015. Our map represents a snapshot in time and may not reflect current leaks. A number of the leaks identified through this collaborative project have already been repaired or eliminated through the replacement of cast iron pipes, including all leaks deemed hazardous by PSE&G's existing leak grading system.
Studies have consistently shown that a few large leaks are often responsible for a substantial portion of emissions from a population of leaks. Here, we observed a similar pattern. The three grids that PSE&G prioritized based on leak flow rate accounted for over 37% of the emissions, but represented only 9% of the gas line miles for which leak flow rates were quantified.
Using leak flow rates for prioritization allowed PSE&G to achieve an 83% reduction of methane emissions early on by replacing one-third fewer miles of gas lines than that needed to achieve the same result under a business as usual scenario. This difference is noteworthy considering that the typical cost to replace one mile of gas line on PSE&G's system is $1.5 to $2.0 million.

The results from PSE&G's leak quantification and gas line prioritization program have significant implications for the nation's gas utilities:
- Older pipes made from cast iron and unprotected steel represent the most leak prone pipelines, according to national studies.
- If PSE&G's ratio of emissions to gas line miles (37% to 9%, respectively) were to be found nationally, prioritizing replacements for 9% of the highest-emitting cast iron gas lines in the nation could result in 12,000 tons of methane emission reductions, which is a comparable climate benefit to taking over 200,000 cars off the roads each year.1
- Significant methane emission reductions through cast iron distribution pipeline replacement programs can be achieved more quickly by using leak flow rate data to prioritize such programs.
Footnote
- Based on a 20-year global warming potential for methane of 84.