Study shows how pollution changes over space and time
Air pollution increases and decreases at specific times and locations in neighborhoods, but we can't see it with the naked eye
Like traffic, pollution increases and decreases throughout the day and night and can be higher at some locations than others. Yet these trends are typically invisible and have been difficult to measure. To better understand how pollution changes over space and time, EDF and our partners collected data for 100 days from 100 black carbon sensors installed across West Oakland. That data, compiled in a new tool, shows how pollution patterns vary sharply by time and location. These results were published in ACS Publications Environmental Science & Technology. Certain areas of West Oakland—truck routes and industrial areas in particular—had markedly higher black carbon pollution, while other areas were much cleaner. Examining these patterns can help researchers, residents and city officials identify causes of pollution at specific locations and take action.
Trucks drive emissions on streets near port
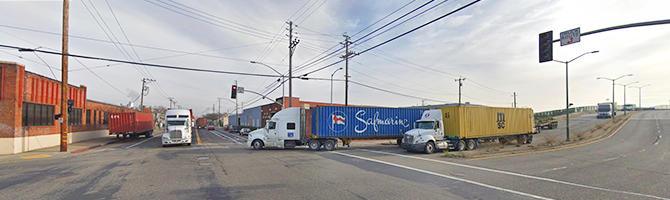
Image ©2019 Google
As one of the busiest container ports in the country, the Port of Oakland attracts diesel-powered ships, trucks and trains that transport goods throughout California and across the United States. As those trucks line up and often idle along the nearby roads and freeways, they also emit pollutants including black carbon. Approximately 7,200 diesel trucks operate at the Port of Oakland and throughout West Oakland. The sensors on the busy Maritime Street along the Port boundary measured black carbon concentrations that averaged 200 percent higher than sensors placed upwind, while measurements from sensors on designated truck routes in the neighborhood averaged 150 percent higher.
Average hourly weekday black carbon (BC) levels over 24 hours at monitors near the Port. As the concentration of black carbon (measured in micrograms per cubic meter) increases, the color turns from yellow to dark red. Data visualization by Distributed Sensing Technologies.
Shift changes and a stop light
This animation shows average black carbon levels over 24-hours on weekdays at monitors near the Port. In the gray shaded circles on Maritime Street, watch black carbon levels as they grow from 4:00 to 8:00 am, when Port operations begin and traffic increases, peaking at up to four times levels observed at monitors upwind of the Port. Black carbon levels at several monitors drop at 5:00 p.m. during shift changes when operations slow.
At the intersection of 3rd St. and Adeline (shaded gray circle at the bottom right) near a main entrance to the Port, long lines of trucks decelerate, idle, then accelerate through a four-way stop light. Here, black carbon levels increase between 3:00 and 9:00 a.m., when they are more than three times higher than the West Oakland neighborhood average. They then dip at noon and drop off after 2:00 p.m.
Industry emissions burden nearby homes
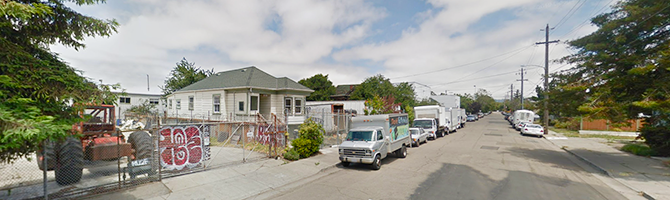
Image ©2019 Google
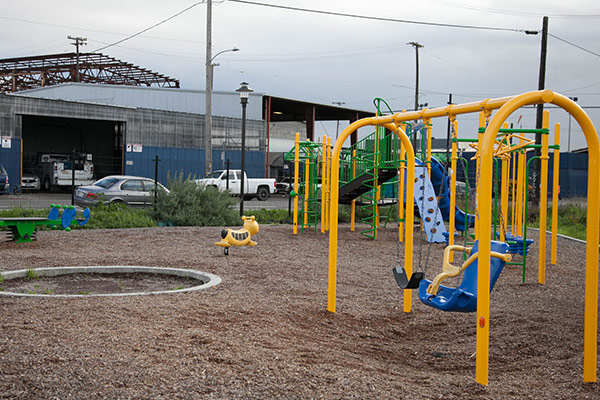
In this section of West Oakland, located to the north and east of the Port, homes mix with industrial facilities. It also features an urban farm and playground, yoga studio, coffee shop, and retail stores, as well as a truck repair shop, metal recycling facility and a moving company. Heavy-duty trucks often fill nearby parking lots.
Average hourly weekday black carbon (BC) levels over 24 hours at 28th and Union Streets. As the concentration of black carbon (measured in micrograms per cubic meter) increases, the color turns from yellow to dark red. Data visualization by Distributed Sensing Technologies.
Pollution drops at mid-day
Black carbon concentrations at 28th and Union Streets (shaded dot near the upper right-hand corner) increase between 6:00 and 8:00 a.m, remaining about twice as high as the neighborhood average during the day. There's a distinct dip in black carbon levels in the middle of the day, which community advocates speculate aligns with workers' lunch breaks. Black carbon levels decrease after 6:00 p.m.
Black carbon rises near playing fields
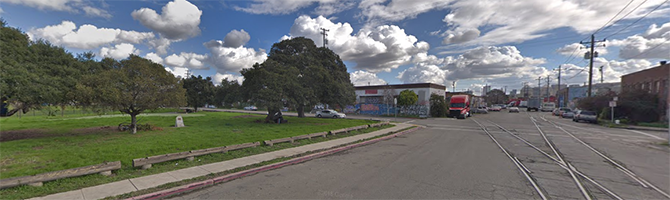
Image ©2019 Google
Raimondi Park features several sports fields, where children and adults play soccer, football and baseball during the daytime and in the evenings. Here, a monitor that was directly downwind from a trucking company across the street from the park tracked pollution patterns that rose in the evenings, increasing exposure for people playing at the nearby fields.
Average hourly weekday black carbon (BC) levels over 24 hours near Raimondi Park. As the concentration of black carbon (measured in micrograms per cubic meter) increases, the color turns from yellow to dark red. Data visualization by Distributed Sensing Technologies.
Night truck activity boosts pollution
Residents living nearby had reported nighttime noise from this trucking facility. Our data shows substantially elevated black carbon levels overnight from 9:00 p.m. until 9:00 a.m., likely related to the use of diesel auxiliary power units running truck refrigeration systems overnight. This trucking facility ceased operations between the time of our study and the publication of this data.
A new tool to support advocacy
Residents and community groups are already engaging with the state and the local air quality management district to make meaningful changes to reduce the pollution burden of West Oakland. This kind of data—coupled with the earlier mobile monitoring data—provides valuable insights into how truck traffic, industrial activity and even the location and timing of traffic lights can increase pollution levels at specific times of day. That actionable intelligence can be critical when making the case for change. Community advocates are using these findings to push for solutions, including re-routing trucks away from homes and ensuring that adequate buffers separate industrial and residential areas.