


For growing our food, nothing is more important than water.
So when drought fueled by climate change grips the western U.S., it’s not just a local problem of water shortages.
We feel it no matter where we live, because that’s where much of our food comes from. That means less in the produce aisle, and what’s there costs more.
A big part of the problem is not knowing how much water is being used in the first place. But there’s a new way of using satellite data that can help farmers figure out how to get as much as they can out of every drop.
It’s like balancing a budget — using science
Imagine having to manage your budget without knowing how much money is coming in and going out. That’s what’s happening with water today in many parts of the West, which is suffering its worst drought in 500 years.
There’s a gap in measuring how much water is being used and how much is being replenished.
A new online platform called OpenET — a joint project of EDF, NASA, Desert Research Institute, Google and others — aims to fill that gap. It makes data about water consumption free and easy to access for farmers, water managers (people responsible for protecting public water supplies) and anyone else.
The ET stands for evapotranspiration, the combination of evaporation from the land’s surface and water vapor released by plants, essentially what plants breathe out.
ET causes plants to cool. The temperature changes show up in satellite images, so scientists can estimate how much water crops are consuming. Farmers can compare that data to how much water they’re using on their crops and adjust accordingly.

This technology will help make sure the food we depend on will be here for years to come.
— Robyn Grimm, senior manager, water information systems
Making complex data from space easy to grasp
From the OpenET website, farmers find their land on a detailed satellite map and choose the timeframes they want to track. They can do it right from the field, using a mobile device. Simple graphs illustrate data that comes from multiple satellites and weather stations.
The data is precise enough to help farmers decide field by field when — and when not — to water their crops. In one trial, an Oregon farmer reduced the amount of water he used on his fields by 25%.
Here's one example of what a farmer might see:
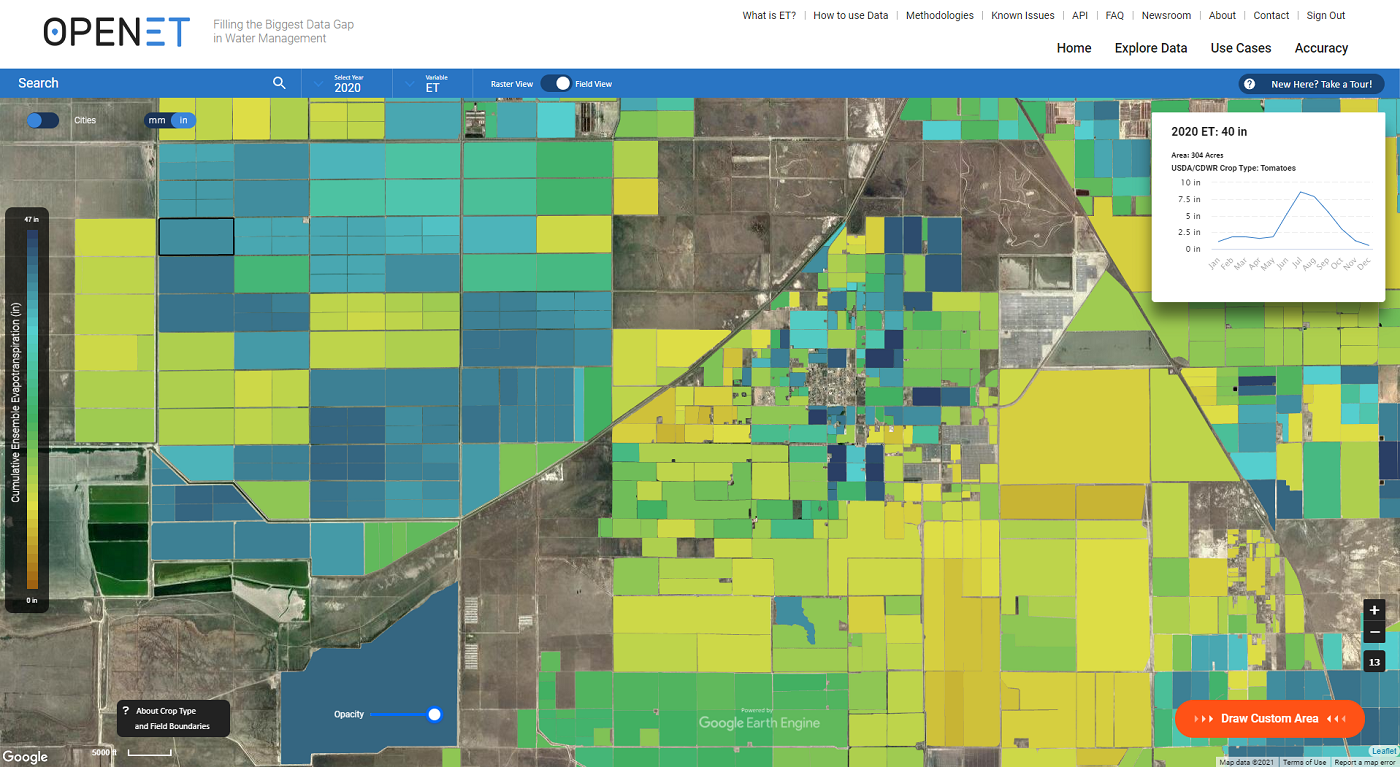
It's a screenshot showing the estimated monthly 2020 water use for a 304-acre field of tomatoes. The graph in the upper right shows a spike in water use during the summer, and the darker blue colors on the map show fields that used the most water that year.
“OpenET provides an opportunity to get more relevant data, real-time data,” says Brett Baker, a sixth-generation pear farmer in California. “It’s really the bird’s-eye view of what’s actually going on, on the ground.”
The goal: to learn more about how much water farms need, get key information for better conservation policy, and inspire more innovative ways to manage water that will help us adapt to having less of it in the face of climate change.
In the West’s new era of extreme heat and intensifying drought, taking action to become more resilient is essential — for the health of the land, farmers’ livelihoods and food on our plates.