

Abstract
Canada has set ambitious methane emission reduction targets for its oil and gas industry, and recently, the province of Saskatchewan—Canada's second largest oil producing region—announced it has already exceeded the first of these targets. Using detailed operator-reported emissions data, published for the first time from Saskatchewan in 2022, we estimate the province's upstream oil and gas methane inventory to independently evaluate the reported emission reductions. While the inventory suggests that Saskatchewan has surpassed its target, the inclusion of recently published site-level aerial measurement data from cold heavy oil production with sand (CHOPS) wells suggests that the methane inventory is underestimated by between 30% and 40%. This inventory update is supported by new regional aerial measurements confirming the continued underestimation of emissions at CHOPS wells. Since these emissions likely evade required reduction under current regulations, we evaluate achievable emission levels if such CHOPS emissions are accurately measured/reported. The results show Saskatchewan can achieve much deeper emission reductions under current regulations with improved emission measurement, reporting, and verification methods. We discuss the benefits and risks inherent in Saskatchewan's regulatory approach where emission limits are primarily set at the operator-level.
Export citation and abstract BibTeX RIS

Original content from this work may be used under the terms of the Creative Commons Attribution 4.0 license. Any further distribution of this work must maintain attribution to the author(s) and the title of the work, journal citation and DOI.
1. Introduction
Methane is a potent greenhouse gas with relatively short atmospheric lifetime (Forster et al 2021, Gulev et al 2021), making it a focus for mitigation globally (UNEP and CCAC 2021). Methane reductions from the oil and gas industry are a key opportunity for abatement; the sector dominates methane totals in many countries and mitigation can largely be accomplished with existing technology (Ocko et al 2021, IEA 2021a, 2022). Canada has signaled its ambitious methane mitigation goals; it is several years into a commitment to reduce oil and gas sector methane by 40%–45% from 2012 levels by 2025 (ECCC 2022b) and recently joined the global methane pledge (ECCC 2022a, CCAC 2023), specifically committing to a 75% reduction in oil and gas sector methane by 2030.
Canada's 2025 methane regulations were implemented in 2020 (Government of Canada 2018a, 2020a, 2020b, 2020c) and the government has since reported that it is on-track to meet the 40%–45% reduction commitment (ECCC 2021b). However, measurements from oil and gas production sites across Canada consistently show that emissions are higher than inventoried. Measurements from flux towers (Chan et al 2020), vehicle surveys (Zavala-Araiza et al 2018, MacKay et al 2021), satellites (Baray et al 2021, Maasakkers et al 2021, Lu et al 2022, Shen et al 2022), and aerial surveys (Johnson and Tyner 2020, Tyner and Johnson 2021) generally find that oil and gas production-related methane emissions are ∼1.4–2 times higher than inventoried. Despite uncertainty in current inventory estimates, the province of Saskatchewan—Canada's second largest oil producing province (CER 2022)—recently announced that it had achieved (and surpassed) its 2025 reduction target (MER 2022). However, independent evaluation of Saskatchewan's methane inventory has been historically difficult because the detailed operator-reported data underpinning it were not made public.
Not only will Saskatchewan play a key role in Canada meeting its methane targets—its oil and gas sector is the second most methane emitting in Canada (ECCC 2023)—but it will also be a critical test of its unique regulatory approach. Saskatchewan's regulations primarily reduce emissions by imposing fleet-level emission limits (an operator's oil production fleet can only emit a specified fraction of its total possible emissions). This fleet-level limit is intended to give operators the flexibility to select mitigation measures and were they are implemented (Government of Saskatchewan 2020b), allowing them to select the most relevant and cost-effective measures for their individual circumstances (Coglianese et al 2003, May 2003, Coglianese 2016, IEA 2021b). Interestingly, the federal government initially rejected the use of fleet-level emission limits (Government of Canada 2018b) before permitting their use in both Saskatchewan and Alberta (Government of Canada 2020a, 2020c). The fleet-level approach is markedly different from other jurisdictions in Canada and the United States, for example, where requirements focus on site- and equipment-level emission performance and/or work practice standards (e.g. leak detection and repair; LDAR) (Mohlin et al 2022). The effectiveness of Saskatchewan's regulations will therefore be of great interest as Canada develops new regulations towards its 2030 emission targets (ECCC 2022c) and for any other jurisdiction considering implementing this regulatory method.
In this paper, we use Saskatchewan's detailed operator-reported emissions and production data (2012–2022)—made available for the first time in 2022—to derive a methane inventory estimate for the province's upstream oil and gas sector following federal inventory methods. This inventory estimate allowed for independent evaluation of Saskatchewan's progress towards its 2025 emission reduction targets, and to assess operator compliance with venting limits. We use recently published aerial LiDAR measurements (Festa-Bianchet et al 2023) to update particularly underestimated emissions from cold heavy oil production with sand (CHOPS) well sites, and we support this update with previously-unpublished regional aerial measurements in a CHOPS-dominant region of Saskatchewan. The updated inventory is used to re-evaluate Saskatchewan's progress towards its 2025 target. Considering underestimated emissions are likely to evade the mitigation required by current regulations, we estimate achievable emission levels if such quantification difficulties are overcome. We also discuss the risks inherent in Saskatchewan's regulatory approach when site-level data may not be reliable.
2. Saskatchewan's methane regulations
Saskatchewan's methane regulations almost exclusively target venting/flaring of associated gas at oil sites, with minor reductions expected from LDAR and emission restrictions during well completion (Government of Saskatchewan 2020b, Government of Canada 2020c). Associated gas emission limits exist at both the site- and operator/fleet-level. Individual oil sites that would vent/flare a combined volume greater than 900 m3 d−1 must flare all non-conserved gas (MER 2020b). At the fleet-level, any operators whose oil production fleet could emit more than 50 kt CO2-equivalent (CO2e) annually must also comply with an overall emission limit (Government of Saskatchewan 2020b). Emission limits for each operator are the product of an emission intensity limit (fraction) and potential emissions (produced gas volumes converted to CO2e using region-specific factors; MacKnight 2020); see SI section S1 for additional details. Interestingly, this emission limit applies to venting and flaring but excludes engine exhaust emissions.
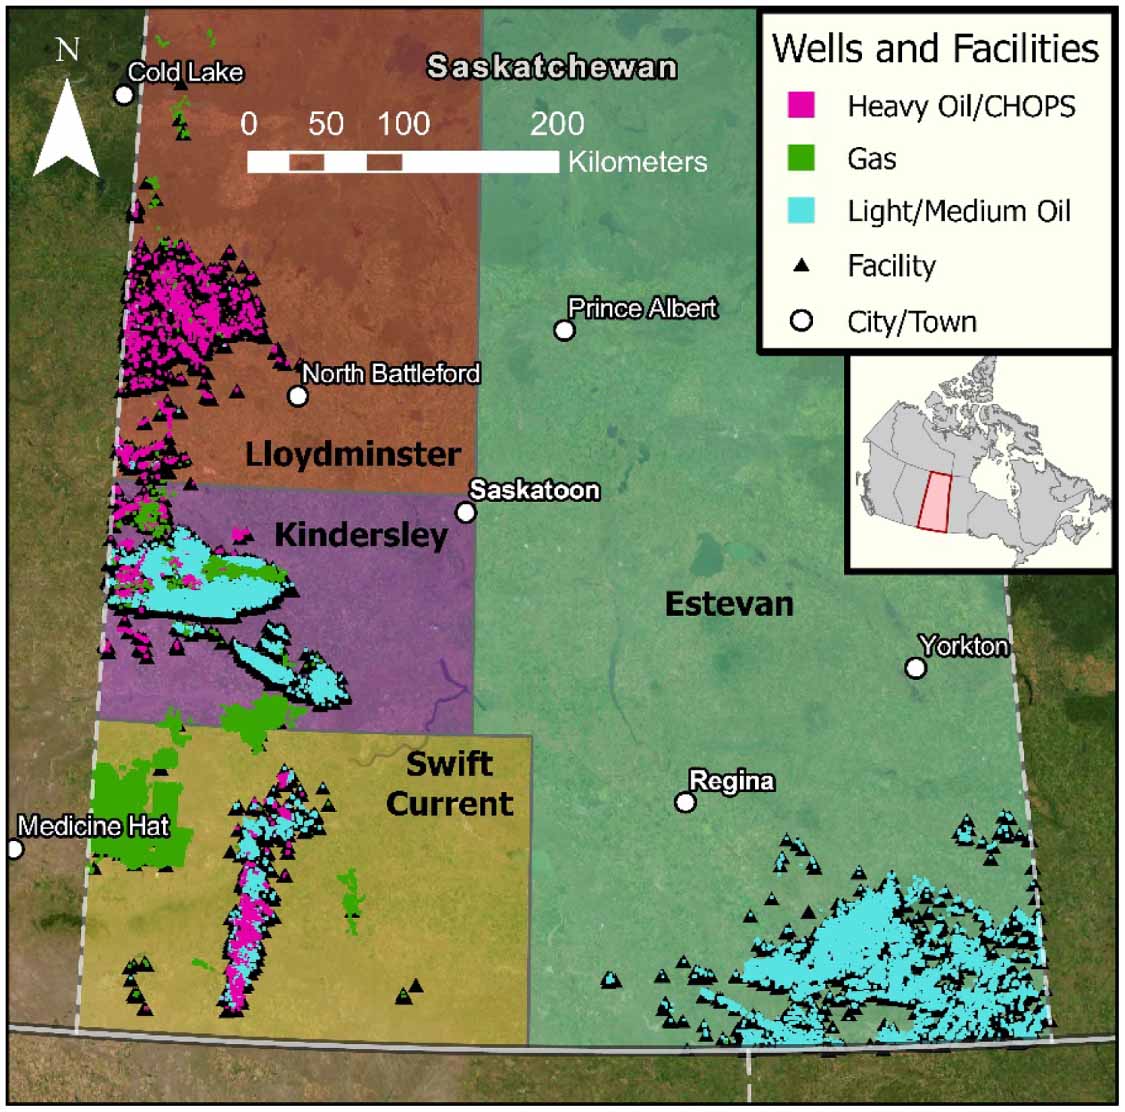
Emission limits are calculated separately for each production region (figure 1), but penalties are calculated after recombining regional emissions and limits for each operator. If an operator exceeds its total emission limit in a given year, Saskatchewan levies penalties which started at CA$10/t CO2e in 2020 and rise by CA$10/t CO2e each year to match the (now former) federal carbon price of CA$50/t in 2024 (ECCC 2021a).

Figure 1. Map of Saskatchewan's upstream oil and gas industry. This shows the province's production regions: Lloydminster, Kindersley (heavy and non-heavy), Swift Current, and Estevan, with an overlay of active wells and facilities in 2022.
Download figure:
Standard image High-resolution imageSaskatchewan's regulations also require twice-annual LDAR surveys for gas facilities (including well batteries) that produce/receive more than 60 000 m3 of gas annually (MER 2020b).
Finally, while Canada's oil and gas sector target is a 40%–45% reduction in methane from 2012 levels by 2025, Saskatchewan has its own, slightly different target. Saskatchewan intends to reduce associated gas emissions (venting and flaring only; in terms of CO2e) by 40%–45% from 2015 levels (Government of Saskatchewan 2017, 2020a). The presented analysis offers conclusions in terms of both federal and provincial objectives.
3. Methods
3.1. Inventory methods
Using federal inventory methods and detailed operator-reported emissions data, we developed a methane inventory estimate for Saskatchewan's upstream oil and gas sector. Similar inventory estimates have been published for Alberta by Johnson and Tyner (2020) and Seymour et al (2022) so a summary of data sources/methods is provided in table 1 and additional details are provided in SI section S2.
Table 1. Summary of Saskatchewan upstream methane inventory methods/data sources. For some, the inventory methods changed in 2020 in response to a change in operator reporting requirements (ECCC 2023).
| Emission source category | Data source/methods, years 2012–2019 | Data source/methods, years 2020–2022 |
|---|---|---|
| Venting, flaring, fuel use | Operator-reported (Petrinex 2023) | |
| Pneumatics, compressor seals | Federal fugitive emissions model (ECCC 2022d), active site counts | Operator-reported (Petrinex 2023) |
| Fugitives | Federal fugitive emissions model (ECCC 2022d), active site counts | If LDAR is required: operator-reported (Petrinex 2023) If LDAR is not required: fugitive emissions model (ECCC 2022d), active site counts |
| Storage losses, compressor starts, glycol dehydrators, tank loading/Unloading | Emissions scaled to each year by production volumes. Estimates from (Clearstone Engineering Ltd 2014) | Operator-reported (Petrinex 2023) |
| Surface casing venting flow and gas migration (SCVF/GM) | SCVF/GM factors from (Clearstone Engineering Ltd 2014), active well counts | |
| Abandoned wells | Emission factors (Williams et al 2021),abandoned wells counts (Petrinex 2023) | |
| Accidents/spills | Gas releases reported to Saskatchewan incident report (MER 2023) | |
As described in section 2, some operators are subject to fleet-level emission limits at their oil sites. Any excess emissions from these operators can be readily calculated from reported emissions in terms of CO2e but not in terms of corresponding methane since emissions could come from any combination of venting and/or flaring. To estimate the excess methane emissions, we assume that reported venting would be preferentially reduced before flaring for each operator to meet its fleet emission limit.
Finally, we also perform a simple, short-term forecast of inventoried emissions to demonstrate Saskatchewan's expected inventory up to 2025. This is done by scaling production and emission volumes from the most recent inventoried year (2022) using forecasted production of light/medium oil, heavy oil, and gas volumes published by the Canada Energy Regulator (CER 2020). Rescaled emissions are then reduced assuming all qualifying operators fully comply with their annual fleet-level emission limits. For reference, between 2022 and 2025, the CER forecasts Saskatchewan's production of light/medium oil to decrease by 23%, heavy oil to increase by 32%, and primary gas production to remain stable. Other oil and gas methane forecasting efforts have considered changes to site counts (ECCC 2021b) but since Saskatchewan's emission limits depend on produced volumes, not site counts, forecasting of the latter is not necessary.
3.2. Inventory updates for CHOPS sites
We updated the methane inventory estimate to account for underreported emissions from CHOPS wells. While Saskatchewan-specific studies (Baillie et al 2019, MacKay et al 2019, Vogt et al 2022) and those quantifying underestimated flare (Tyner and Johnson 2021, Plant et al 2022, Seymour et al 2022) and combustion slip emissions (Vaughn et al 2017, Tyner and Johnson 2021, Lyman et al 2022, Johnson et al 2023b) were considered for inclusion in an updated inventory, it was unclear how to derive region-specific updates for the current inventory.
Recent equipment-level aerial LiDAR surveys (Johnson et al 2021, Tyner and Johnson 2021) by Festa-Bianchet et al (2023) measured methane emissions from over 900 single-well CHOPS sites in Saskatchewan, finding emissions ∼3.9 times higher than reportedly vented. This finding was incorporated into the inventory using production volume- and site count-scaling approaches, two common methods employed elsewhere in the federal inventory (Clearstone Engineering Ltd 2014, ECCC 2022d, 2023). For production-scaling, since Festa-Bianchet et al (2023) found CHOPS sites were emitting 7% more methane than they reportedly produce, CHOPS site emissions can be scaled up 7% from reported methane production. For active count-scaling, the average CHOPS site emission rate (10.9 kg h−1) can be applied to each CHOPS site.
Since the aerial LiDAR survey measured all on-site methane emissions above its detection threshold (Conrad et al 2023), any other reported/estimated methane emissions on-site (flare, fuel use, fugitives) were removed when applying the updated emission estimates. Finally, because CHOPS wells are not explicitly distinguished from other heavy oil wells in the reported data, we follow a similar definition to Festa-Bianchet et al by considering heavy oil wells 'CHOPS' if they reported sand dispositions (MER 2018).
3.3. Aerial mass balance measurements
To support previous findings of underestimated CHOPS methane, and to test the validity of our CHOPS-updated inventory, we conducted regional aerial methane emission measurements in Saskatchewan. Partnering with Scientific Aviation (Boulder, Colorado, US), regional methane emissions were measured using an aerial mass balance approach (Conley et al 2017) for a 40 km by 40 km CHOPS region near Lloydminster, Saskatchewan. The survey made two separate measurements of the area, performing six laps each on Sept. 13th and 22nd, 2022, following the designated flight path (see section 4.4) at different altitudes up to the top of the boundary layer.
Instruments were mounted inside the trunk space of a fixed wing single-engine Mooney M-20 manned aircraft. A Picarro G2301 gas analyzer (Picarro, Inc., Santa Clara, CA) measured in-situ methane concentrations at 1 Hz frequency at a flow rate of 0.2 SLPM from a 1/8 in. OD (3.175 mm) stainless steel sampling probe installed beneath the right wing. A standard aircraft pitot tube measured wind speeds. Flux estimates were based on Gauss's theorem (Conley et al 2017). The methane emission flux divergence integral was calculated for each altitude bin and then summed across all bins to obtain regional methane emission rates. Resulting measured emission rates had contributions subtracted for livestock, solid waste, wastewater, coal mines, and wetlands (Bloom et al 2017, Scarpelli et al 2022); see SI section S3 for details.
4. Results and discussion
4.1. Saskatchewan upstream methane inventory
Figure 2 shows our estimate of Saskatchewan's upstream oil and gas methane inventory for 2012–2022. Unfortunately, it is difficult to validate this estimate against the published federal inventory since the latter aggregates upstream, downstream, and end-use estimates in Saskatchewan. Nevertheless, our upstream methane estimate represents between 74% and 86% of the federal estimate of Saskatchewan's oil and gas sector (ECCC 2023). Importantly, our inventory estimate indeed suggests that Saskatchewan's upstream sector has surpassed the federal target of a 40%–45% reduction in methane from 2012 levels (47%); similarly, Saskatchewan has seemingly surpassed its associated gas reduction target of 40%–45% from 2015 levels (67%; see figure S2).

Figure 2. Methane inventory estimate for Saskatchewan's upstream oil and gas sector. This inventory—employing federal government methodologies—suggests that Saskatchewan has reduced its upstream methane emissions by 47% from 2012 levels.
Download figure:
Standard image High-resolution imageInventoried reductions are overwhelmingly from reduced venting. Reported venting in 2022 dropped to a third of pre-regulation (2019) levels, driven by reductions at light/medium oil and CHOPS sites (see figure S6). Methane loss rates can be derived for Saskatchewan by normalizing emitted methane by produced methane, knowing produced gas volumes (Petrinex 2023) and average gas compositions (ECCC 2023), although this excludes emissions not directly tied to produced gas (e.g. SCVF, abandoned wells). Since 2012 levels, the province's overall methane loss rate of 12% rose to ∼16% in 2018 before reducing to 9% in 2022. Despite Saskatchewan's produced energy having decreased by 25% since 2012 (see figure S5), associated gas production—the dominant source of reported emissions—increased 4% over that same period, implying that reductions in total venting are due to improved loss rates.
Inventoried methane reductions were also achieved from LDAR but to a much lesser extent. For 2020–2022, LDAR reduced estimated fugitive methane by only ∼4–5 kt per year (1%–2% of the inventory). In 2022, the 858 LDAR-requiring sites constituted 91% of gas batteries, plants, and gas gathering systems, but less than 4% of gas wells. More broadly, this means that LDAR surveying was required at 4% of all upstream facilities and ∼1% of all wells in Saskatchewan. By comparison, LDAR in Alberta, Canada, was required at 85% of (non-mined oil sands) upstream facilities and 26% of wells (Seymour et al 2022). Importantly, this assumes full compliance, which has been an issue in other jurisdictions (BC Oil and Gas Commission 2021, AER 2022).
The federal inventory experienced a shift in methodology beginning in 2020, removing federal government estimates for pneumatics, storage losses, etc (see table 1). Instead, such emissions would thereafter be reported by operators under existing vent, flare, and fuel use categories (Petrinex 2019, MER 2019a, 2020a). Unfortunately, it is not possible to confirm that these emission sources are reliably reported by operators since the different types (e.g. venting, pneumatics, storage losses) are all reported to a generic 'vent' category—an issue likely to complicate regulatory development (UNEP 2022). Although Seymour et al (2022) found that the same methodology shift in Alberta likely overstated emission reductions by ∼20% since 2012 levels, these emission categories represent only ∼9% of the Saskatchewan inventory (∼70% in Alberta).
While these inventoried emission reductions appear promising, it is important to consider that many of these operator-reported emissions may still rely on simple engineering estimates or generic emission factors (MER 2019a). Even where operators are conducting measurements, this cannot be distinguished from emission factor-based estimates in the reported data.
4.2. Operator compliance
Here, we evaluate operators' reported compliance with fleet-level emission limits and calculate the penalties levied against exceedances. For operators with fleet-level emission limits, emissions and produced gas reports were grouped by site ownership and production region, and CO2e emission limits were calculated for each (Government of Saskatchewan 2020b). Penalties were then assessed after recombining regional data; the findings are summarized in table 2.
Table 2. Summary of reported operator compliance with fleet-level emission limits at oil sites in Saskatchewan, including operator counts and estimates of excess emissions from industry-reported flaring and venting.
| Year | Operators with regional vent limits | Operators exceeding limits | Excess CO2e [kt] | Penalties [CAD] | Estimated excess methane [kt] |
|---|---|---|---|---|---|
| 2020 | 36 | 11 | 166 | $1700 000 | 3.9 |
| 2021 | 39 | 12 | 150 | $3000 000 | 3.3 |
| 2022 | 36 | 8 | 72 | $2200 000 | 1.6 |
In 2022, 8 of the 36 (22%) operators exceeded their respective emission limits, totaling 72 kt CO2e or an estimated 1.6 kt of methane (0.7% of the 2022 inventory) and a penalty of CA$2.2 million. This is seemingly an improvement from 2020, in which 31% of noncompliant operators emitted an excess 166 kt CO2e (3.9 kt methane; 1.4% of the 2020 inventory).
4.3. CHOPS-updated inventory estimates
Although the current inventory method suggests that Saskatchewan has achieved its emission reduction commitments, some emissions remain underestimated. Figure 3(a) shows the updated inventory (forecasted to 2025) updating emission estimates for CHOPS well sites; figure 3(b) shows the relative reductions since each estimate's respective 2012 baseline level. The figure shows that—considering underreported emissions from CHOPS only—Saskatchewan's upstream oil and gas methane emissions are generally at least 30% higher than currently estimated. However, figure 3(b) shows that Saskatchewan may nevertheless reach its relative reduction target (although the production-scaled CHOPS update may only achieve a 39% reduction). In terms of Saskatchewan's CO2e target, the province will likely meet the target (see figure S3).

Figure 3. (a) Original and CHOPS-updated inventory estimates for 2012–2022 and (b) relative reductions since their respective 2012 baseline inventories. In each case, Saskatchewan is still likely to meet its methane reduction target despite underreported CHOPS emissions, although the production volume-scaled estimate indicates Saskatchewan may only achieve a 39% reduction.
Download figure:
Standard image High-resolution imageWhile these conclusions are encouraging, the spread of relative reductions using different scaling methods in figure 3(b) illustrates the inherent uncertainty in updating the inventory using a survey conducted only in 2021. No doubt this uncertainty will increase as additional measurement data are included in the inventory, as is expected in Canada's next national inventory report (ECCC 2023, OAGC 2023). Despite Saskatchewan's possible success in achieving the 40% reduction from 2012 levels, the updated inventory suggests that CHOPS will have emitted an additional 1.7 or 2.3 Mt of methane between 2012 and 2022, cumulatively. This significant underreported methane could have, for example, provided heat for an estimated ∼100 000 households in Canada over the same 11 year period.
Interestingly, the two updated inventories stay closely aligned, only beginning to diverge for inventoried years far away from the aerial LiDAR survey year (2021). Divergence is not uncommon when extrapolating measurement data over a long period as changes to on-site technology and/or production practices (Husky Energy Inc. 2020) cannot be captured by a short-term survey. Clearly, it will be necessary for measurement surveys to be conducted frequently to minimize the need for measurement extrapolations and their associated uncertainty.
The updates to the inventory show the outsized impact CHOPS has on Saskatchewan's upstream methane emissions. Emissions from light/medium oil sites were previously the largest emission source (often ∼50% of the inventory; see SI section S5), but after correcting for underreported CHOPS emissions, CHOPS emissions are the largest emitting site type. The implicit risk is that CHOPS might have been overlooked as a source of significant and cost-effective emission reductions during the development of current regulations (Tyner and Johnson 2018). Although the federal government did consider the impact of higher-than-inventoried emissions (Government of Canada 2018b), it is unclear whether sufficient emphasis was placed on CHOPS. Clearly, robust measurement, reporting, and verification (MRV) are needed to ensure both the emission magnitudes and source distributions are properly assessed, a critical aspect when designing future regulations (UNEP 2022, ECCC 2022c).
4.4. Comparison of regional aerial measurements to inventory
We conducted two aerial mass balance measurements over a CHOPS-dominant region near Lloydminster, Saskatchewan, with non-upstream emissions subtracted. These top–down measurements are compared with the inventory estimates for the region in figure 4. The region contained—based on our site type definition (section 3.2)—552 single-well CHOPS sites, 412 other single-well heavy oil sites, five multi-well CHOPS batteries (20 on-site wells), and 34 gas wells. Measured emission rates were ∼2.8 times higher than Saskatchewan's current inventory would suggest, indicating that CHOPS emissions continue to be underreported despite being a known issue since at least 2016 (Johnson et al 2017). However, our CHOPS-updated inventory estimates for the region—also included in figure 4—agree with the regional measurements within uncertainties. This supports the idea that such inventory updates from aerial LiDAR surveys could be used in the current federal inventory at least until more comprehensive inventory methods can be implemented (e.g. Johnson et al 2023a).

Figure 4. Comparison of regional aerial mass balance measurements with the original and CHOPS-updated inventories for the surveyed region near Lloydminster, Saskatchewan. Methane emission rates were roughly 2.8 times higher than what the region's upstream inventory would suggest. However, the CHOPS-updated inventory agrees with the regional aerial measurements within uncertainties.
Download figure:
Standard image High-resolution image4.5. Achievable emission levels
Underestimated emissions are likely to evade the control/mitigation required under current regulations. If, however, these emissions can be reliably quantified and reported, and operators meet their emission limits, the current regulations are expected to provide much deeper emission reductions than if underreporting is allowed to continue (i.e. figure 3). To compute possible emission levels, we add the estimated CHOPS emissions derived in sect. 4.3 to each operator's total and reduce them as needed to comply with their respective fleet-level limits. This is repeated for each year between 2023 and 2025 using both CHOPS-updated inventory estimates (production- and site count-scaled) to illustrate achievable emission levels under current regulations. See SI section S6 for a sensitivity analysis of these results in scenarios where CHOPS gas production is also assumed to be underestimated.
Figure 5 compares the current inventory trajectory (with underreported CHOPS emissions) with the scenario where CHOPS emissions are accurately measured/reported and subsequently controlled following current regulations; figure S4 shows the same scenarios for Saskatchewan's provincial CO2e target. Figure 5(a) shows that full compliance and accurate reporting could reduce emissions by at least 50 kt of methane annually (a ∼15% decrease in emissions from the current trajectory), achieving relative reductions of at least 54% from 2012 levels in figure 5(b). To achieve this, however, improved MRV requirements and full operator compliance are needed.

Figure 5. Saskatchewan (a) methane inventory and (b) relative emission reductions from 2012 levels for 2020–2025 under the current trajectory with underestimated CHOPS emissions and with improved MRV such that CHOPS emissions are accurately measured and reported, and reduced as required by the province's regulations. This shows that Saskatchewan should achieve much deeper emission reductions with improved MRV.
Download figure:
Standard image High-resolution image
5. Implications
With accurate measurement and reporting, and full compliance with the regulations, Saskatchewan's regulations appear resilient to the currently underestimated CHOPS emissions. However, if operator-reported emissions data remains unreliable, the fleet-level regulatory approach used by Saskatchewan could introduce additional difficulties in methane quantification and compliance assurance.
If issues with site-level reported emissions persist, it will remain difficult to determine whether an individual operator is meeting its fleet-level emission limits without independent measurements. While some uncertainty in reported emissions is expected (e.g. Saskatchewan requires single-point measurement uncertainties for gas to be within ±3%; MER 2020a), this requirement is clearly not being met when ∼290% more emissions were observed than reportedly vented at CHOPS sites (Festa-Bianchet et al 2023; section 4.4). Interestingly, such sites often estimate gas production as well. A characteristic gas-oil ratio (GOR) is measured/estimated periodically and is used to estimate produced gas volumes from measured oil production (MER 2020a). It is possible that GOR results are negatively impacted by estimated tank emissions (MER 2020a) and/or variable gas flowrates (Roscioli et al 2018, Festa-Bianchet et al 2023) but there may also be a lack of long-term stability in the GOR caused by, for example, gas pockets and/or gas caps in the formation (Dusseault 2002, Peachey 2004, Speight 2019). These issues could hamper the accuracy of estimated emissions.
Since many emissions continue to be estimated (MER 2019a) and there are minimal on-site surveys (LDAR is only conducted at some gas sites), mitigation actions taken by operators will be driven by emission estimates of equipment often assumed to be operating nominally. More reliable—and potentially long-term—measurement methods are therefore needed to constrain emission reporting uncertainties to required levels and to direct mitigation action to the largest sources of emission. For any source types where emission quantification remains challenging, a regulatory framework relying on work practice standards (e.g. LDAR, required use of no-bleed pneumatic devices) may be a more suitable option for effective methane mitigation since they could achieve emission reductions even if their mitigation impact is uncertain (IEA 2021b, Mohlin et al 2022).
For CHOP(S) specifically, methane emissions have been successfully curtailed elsewhere, suggesting that mitigation is possible. In Peace River, Alberta, methane emissions were significantly reduced in response to odor controlling regulations (AER 2018, Lavoie et al 2021), while reportedly not impacting the region's production (Connoy et al 2022). Despite there being differences in CHOPS by region (Haydu and Smith 2015, Peachey 2015), the fact that significantly more methane is being emitted than reported suggests that more mitigation strategies are likely cost-effective (Tyner and Johnson 2018). Even where CHOPS sites are without electrical grid or pipeline access, many mitigation strategies for CHOPS have been explored (Peachey 2015, Sentio Engineering 2015, Clearstone Engineering Ltd 2017, Tyner and Johnson 2018, Emery et al 2020), including those specific to casing gas vents which is a dominant source of CHOPS emissions in Saskatchewan (Festa-Bianchet et al 2023).
Finally, Saskatchewan's regulatory approach could lead to more difficult quantification by independent surveys. Since operators are given considerable flexibility on where and which mitigation measures are implemented, divergent site designs could develop over time (Coglianese 2016), thereby requiring larger sample sizes to be representative. While Saskatchewan requires some reporting on emission reduction plans (MER 2019b) these data are currently not made public.
6. Conclusions
While we found that the Saskatchewan's upstream oil and gas sector has seemingly succeeded in reducing its methane emissions by 40%–45% from 2012 levels, the reported data underpinning this inventory continues to underestimate emissions. The inclusion of aerial LiDAR measurement data for CHOPS wells suggests that the inventory is underestimated by between 30% and 40%; an update that was further supported by new regional aerial measurements.
If, however, these emissions can be reliably measured/reported, and operators fully comply with emission limits, the current regulations could achieve much deeper emission reductions towards Saskatchewan's 2025 targets. Without accurate site-level emissions reporting, it will remain difficult for Saskatchewan to assess operator compliance with fleet-level emission limits. For accurate reporting, improved MRV requirements are critically needed. Where quantification remains difficult, future regulations should consider the use of work practice standards (e.g. requiring non-emitting pneumatic devices) instead of fleet-level emission limits to achieve the necessary emission reductions.
Acknowledgments
The authors would like to thank the Saskatchewan Ministry of Energy and Resources for their guidance on interpreting and implementing the provincial regulations for this analysis.
Data availability statement
Data were accessed from the publicly available Petrinex database (www.petrinex.ca/PD/Pages/SPD.aspx) and by contacting the Government of Saskatchewan's Ministry of Energy and Resources (er.servicedesk@gov.sk.ca).
Funding
This work has been generously supported by the McCall MacBain Foundation and by McGill University (Vadasz Scholars Program).
Contributions
Contributed to the conception and design: S P S, D X, H Z L, K M
Contributed to analysis and interpretation of data: S P S, H Z L, D X
Drafted/revised the article: S P S, H Z L, D X, K M, M K
Approved the submitted version for publication: S P S, H Z L, D X, K M, M K
Conflict of interest
The authors declare that they have no known competing interests.
Supplementary data (0.8 MB PDF)